A few months back I made a prototype application for Swarco Technology the Bike Timer application. This prototype proved to be interesting to Swarco Techonlogy and they wanted to build a fully functional application. As I was at the last two semesters of my master in Software Engineering I had to start working on my master thesis. This project seemed like a great opportunity! So a collaboration was estasblished between Swarco Techonlogy, a fellow student, Thomas Lemqvist, and I.
A full documentation of this collaboration can be see in our master thesis report. A demonstration video of the application is shown below and exaplained in Danish (Sorry about that, non Danish-speaker).
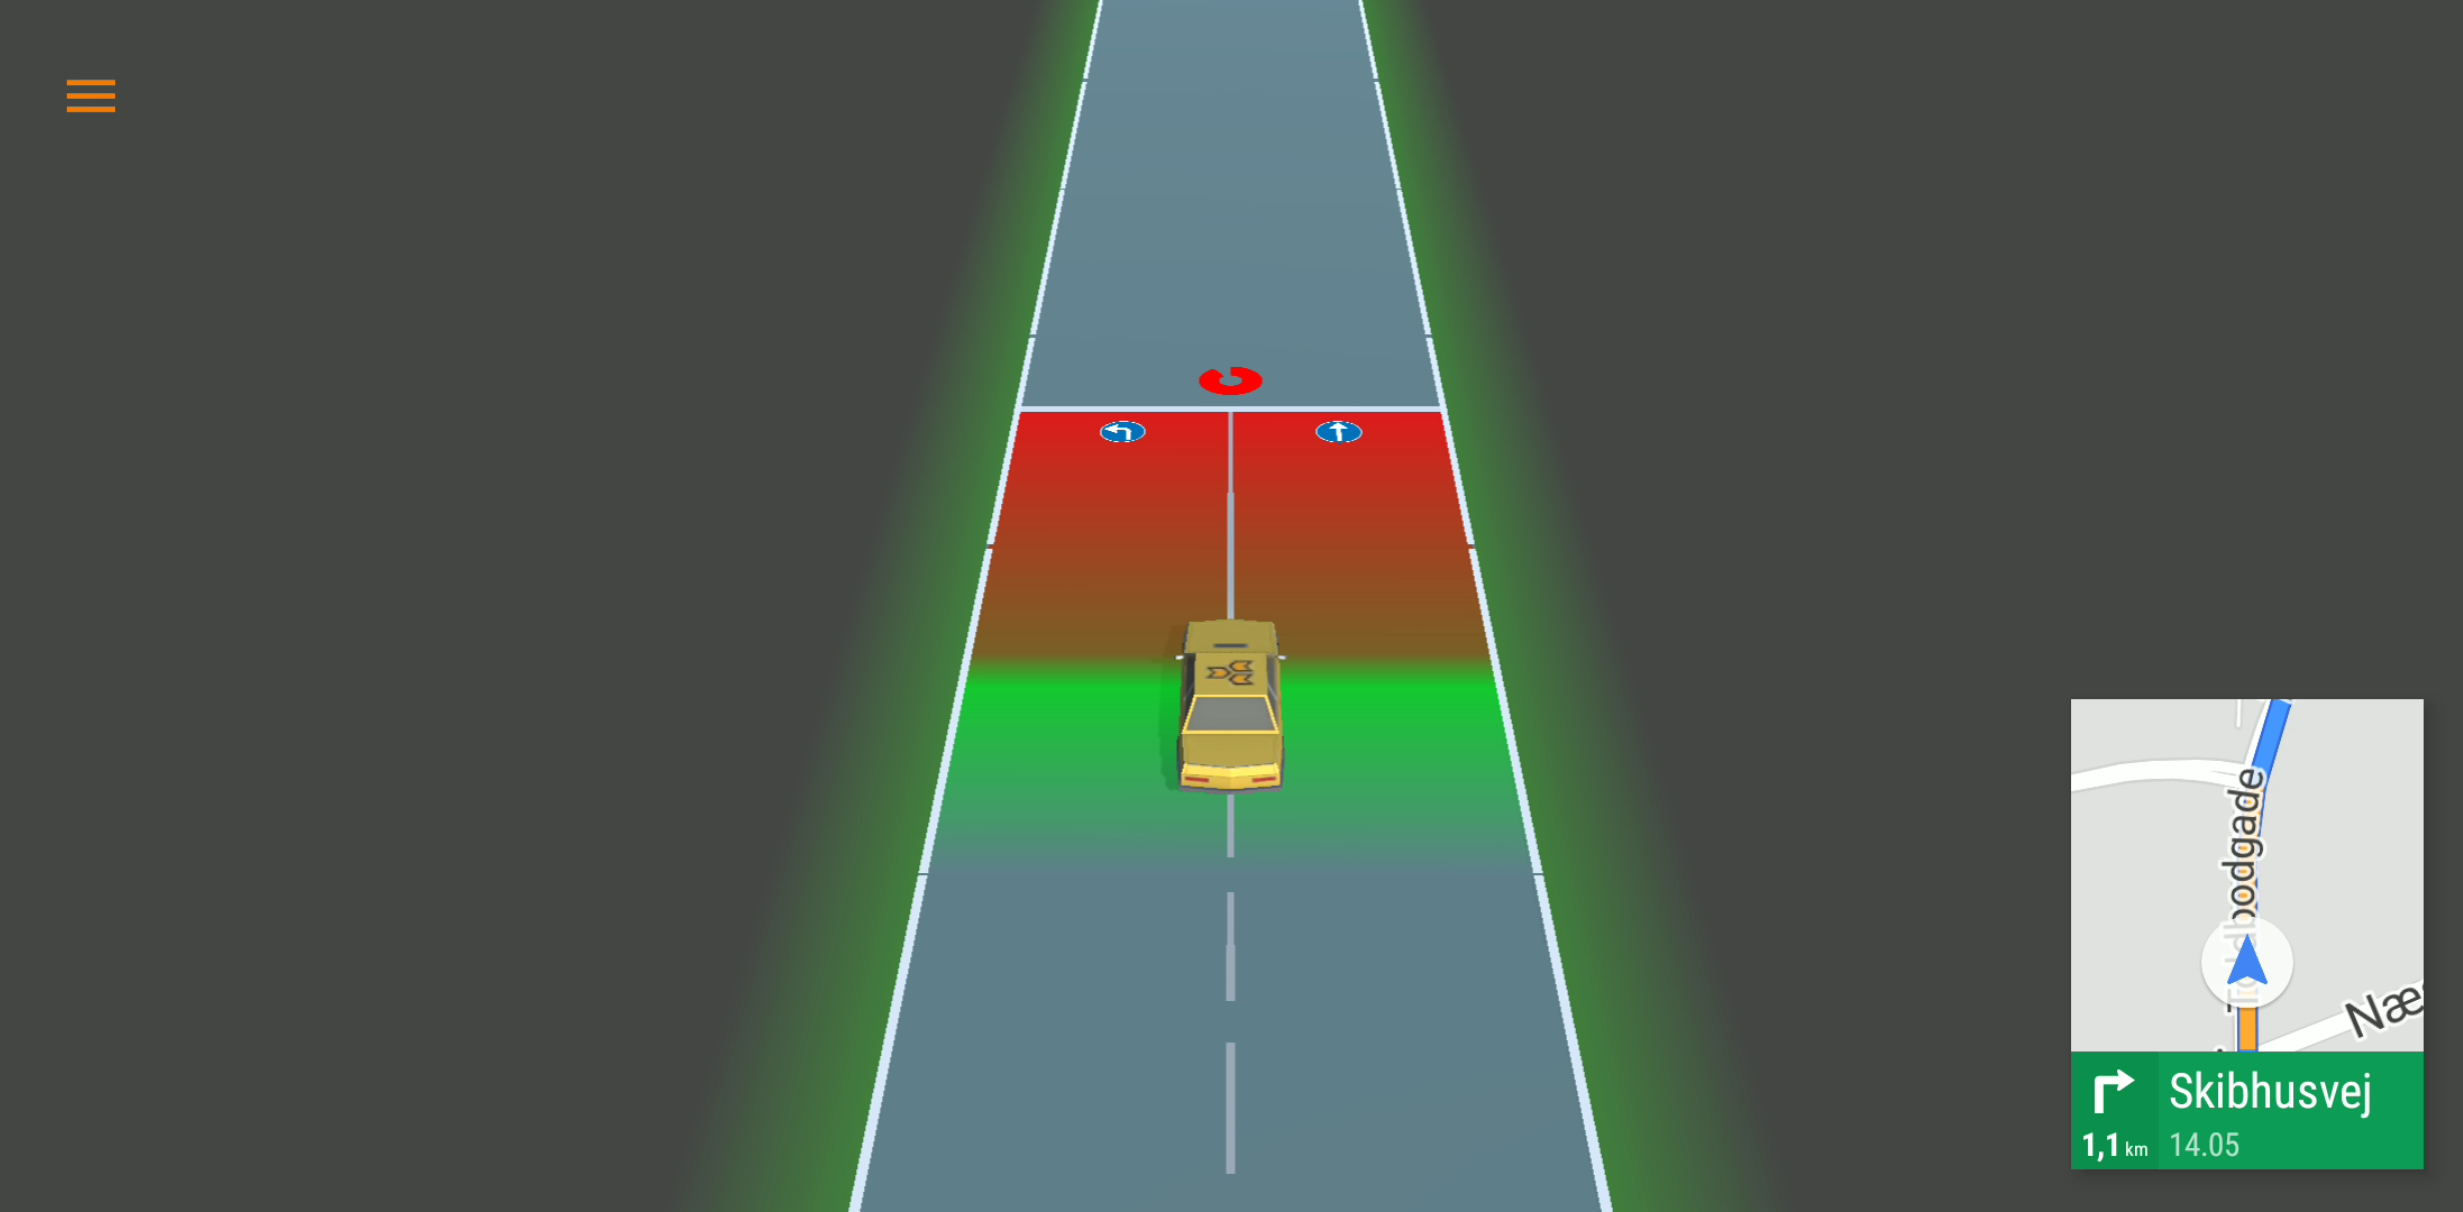
The above image shows the Android application that was built throughout the project. Imagine yourself driving in a car towards an intersection unbeknownst of when the traffic signal will turn green. All you see is a red signal which you are eagerly expecting to turn green so you can pass the intersection.
But what if you knew exactly when the signal would turn green? Then you would be able to perfectly time your speed according to the expected signal turn and avoid stopping at the intersection because you drove too fast!
This is what the projection in the application tries to represent. The white line in front of the car being the intersection and the car being yourself. The red area then represents the time in which the signal is red. The goal is then to try and keep your car within the green area. Now imagine everything moving in real-time…. Okay… I think that may be hard to imagine – watch the video below to get an even better picture of what the application is!
The above video shows both a simulation and a real drive in Odense, Denmark using the product of the master thesis project. It is seen how an application is able to stream real-time data between an Android device and intersections out on the street. This allows our application to present an optimized speed recommendation (GLOSA) for drivers, which helps drivers avoid unneccessary stops.
The visualization seen in the Android application was made possible using the Unity game engine. A Unity player was embedded inside an Android application which allowed us to build an application which fully looked and felt like a regular native Android application – all meanwhile a 3d game engine was running inside an Android fragment.
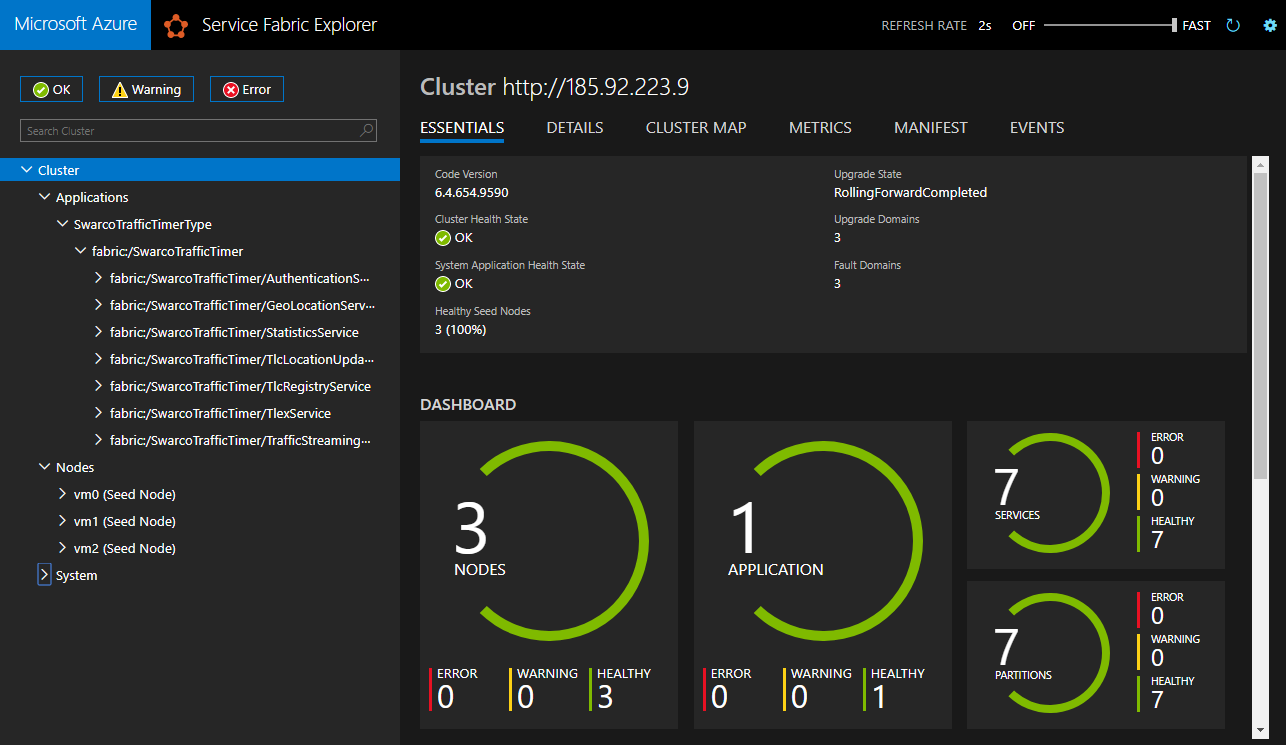
The image above shows the dashboard panel than comes with Service Fabric which is a solution for building microservices. The big part of the master thesis project was actually to build the microservices architecture that was deemed a requirement for the project. Reasoning being that there is a lot of cars in the world and if they would all communicate with our servers. Well, let’s just say that’s a lot of data. This is of course under the assumption that a lot we have actually aquired that many users – which we probably never would, but it is an interesting topic for study purposes.
Working with microservices was an interesting affaire. There is a whole heap of operational concerns that comes into play. Instead of simple hosting your services on http://myip:80 you have to consider what happens if your services in multiple places. How will you redirect call to each of your services? Well, you need to consider a reverse proxy and a load balancer. And an even more complicated case; what is the services is hosted multiple times on the same node/computer – yes, it is a thing for reliability reasons – then how do you deal with two services trying to use the same internal port? A unique URI to each service is the answer to that question. A lot of these sorts of concerns are necessary to consider when trying to build a microservices solution. However, when you get it all setup and running then you will be able to automatically scale your system dependant on usage. This may result in saving some money in the long run.
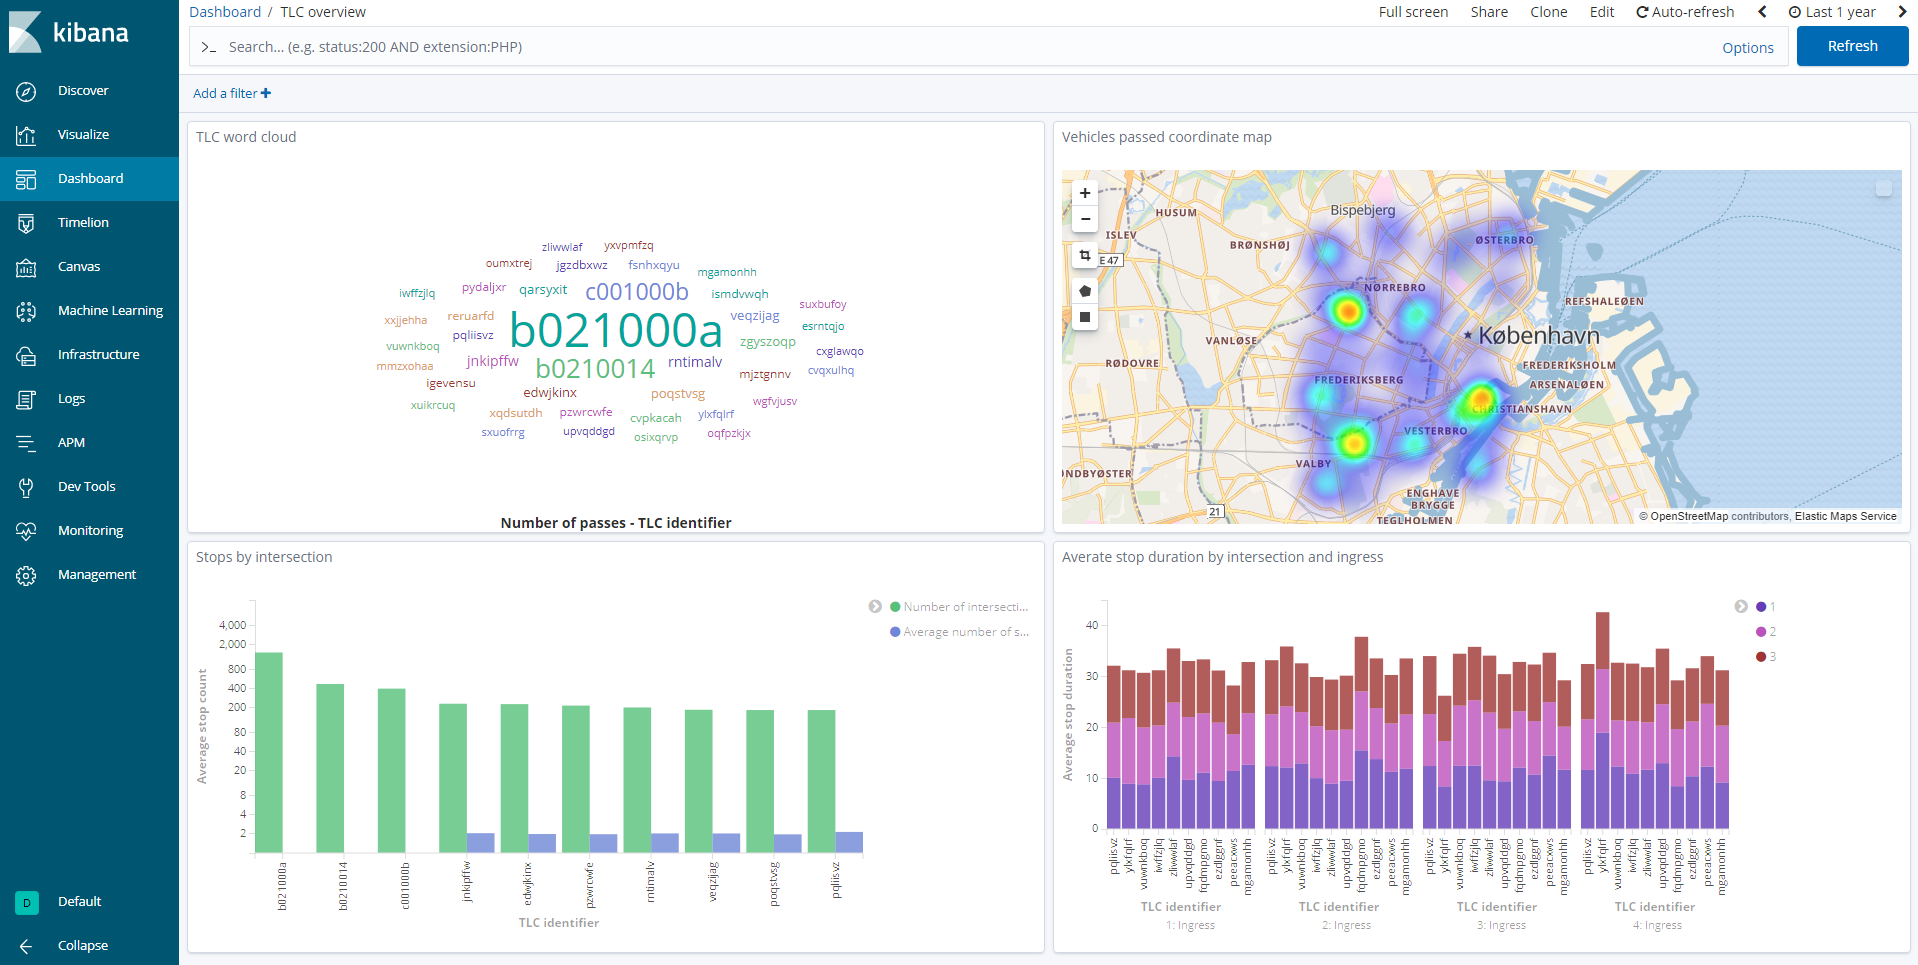
Finally a way of collecting data and presenting statistics was required. Elasticsearch was used to accomplish the data collection while Kibana was used to present statistics and to view logs. The above image shows a heatmap in the top right corner. This heatmap shows how many cars have driven through intersections in the area. By having a vast amount of users some quite useful information can be gathered and used to optimize all the involved intersections. As of today there is not really any way of automatically gathering this sort of data which makes the system a good candidate for optimization of intersections.
Also, Elasticsearch is simple just good with a huge amount of data which was deemed as a requirement for this project. Several terabytes of data was estimated to be gathered within a year – under the presumption that most intersections and cars in Denmark would start using the system.

